Spend analysis A to Z
In our previous article, we have mainly looked into key foundations for a successful everlasting spend analysis capability within the organization. Here, we will be digging deeper into the weeds and share with you best practices but also major traps identified in this area for the last decade.
Cleanse your raw data
Once you have accessed and scoped your data it’s time to cleans and massage it to maximize the gains. There are thousands of books written only on this specifics topic but to scratch the surface there are a couple of key steps to perform:
- Identify unique fields: This is where the cross-functional and collaboration aspect becomes key — working with data stewards and functional owners of data, it is key to identify and confirm unique data fields — these are going to be used later on to merge data from different data sources. This becomes extremely important if the organization has disparate ERPs operating in silos.
- Make formats homogenous: the basic action here is to make sure all relevant data fields have the same format e.g. dates across all sources, times, numbers.
- Create a key for ambiguous fields: when there are different sources of data multiple ID’s could be confusing e.g. supplier ID and supplier name — one best practice to unique key to identify and map these across all sources — more sophisticated approaches here are creating indexes and parent families for this type of data.
- Define constants: Data coming from different ERPs are never complete — if we know that all the spend should be in $ then for the part of data that is missing the spend unit these should be applied.
- Timing of data: Make sure that all extracts are being made with the same period — leaving this to data owners across different functions will lead to deviation in timing (finance calendar, versus AP calendar vs. X function calendar — they are all different!)
- Perform high-level checks: There are more sophisticated methods here but the very basic one is to involve functional owners to review and provide green light on data scope. E.g. If the manufacturing team knows that they spend 30 Mln$ on calibration and data shows 50mln% or 10 Mln$ this is a red flag and needs to be resolved before moving any further.
Pay attention: AP Spend in spend analysis system will be different from the accounting treatment of spend for the same period — these differences could be many things including: Adjust for depreciation, spends outside of AP transactions, BU exclusions, and so forth. Make sure for each data owner you have specific areas to review and provide feedback. There is almost no company that all the spend is captured within AP or even PO’s.
Define the commodity category structure; your spend taxonomy
According to the latest research over 53% across all industries and 88% of best in class companies use an internal — developed spend taxonomy which is useful to communicate the spend as well as use to develop strategies across each of the commodities. This is usually ended up being supplier sourced driven taking into account historical RFX and components drawings; however, there is no correct abstract answer to this choice. To develop the best in class taxonomy few key questions needs to be answered organizational-wide — as this will be foundational for any gains to be achieved from this initiative; here are our recommendations for these key questions:
Guidelines:
- Usage case: Is the organization sharing transactional data with other companies or will it be used internally only?
- Right granularity: Define the right level of granularity by setting floor and cap guidelines.
- At the lowest level, a commodity should be large enough to manage, but not too large. E.g. Procurement team agrees that anything above 0.5Mln should be managed standalone.
- Depending on the expected rate of return from the initiative, each commodity group should be allocated to a relevant number of FTE’s aligned with their experience and skills as well as the cost associated with them.
- Consistency & flexibility: Spend taxonomy must be consistent across the whole structure (no overlapping / no repetition) and this needs to be forced by good governance. The other piece is that taxonomy is ever-evolving together with organization services, products, and strategy — therefore spend taxonomy should be flexible enough to satisfy these needs along the way.
- Potential trap: One of the big traps for organizations is to spend too much time trying to get to perfect taxonomy. Our advice is the same for data quality — perfect taxonomy doesn’t exist and never will be there. Start with a reasonable/good one and make sure to improve on it over time. Remember this is a repetitive (continuous improvement) and ever-evolving process. Perfection can be never manifested here as it shouldn’t!
Start Classifying your transactions using your taxonomy
Once you have the right data and taxonomy in place — first you have to recognize achieving such big milestones and celebrate it with your team! remember many companies will bypass these foundations to expedite getting into value not knowing that this will create inefficiencies at its best not to mention it might minimize the gains. Many organizations never reach these milestones due to a lack of leadership commitments to the program. so again, once you get here you gotta celebrate as you have managed to pass the most challenging piece.
In the last decade organizations and solution providers have gone experimenting with lots of different ways to allocate records to the right bucket (taxonomy level). From manual labor-intensive one-by-one record review to rule-based classification and to using AI solutions each expert might have different experiences and be biased toward one or multiple. The lessons learned are again no straight answers but pretty good guidelines. If your org scoped transactions are in order of a few thousand probably manual review or simple rule-based (rule-based classification needs dedicated review and maintenance) method will do the job. However, if the magnitude is in the order of hundreds of thousands our suggestion is to utilize AI to facilitate 80- 90% of records and your teams only review and provide feedback (we will talk about this in much more detail in later posts). In most cases there will be hybrid approaches of manual classification, mass AI auto-classification, and applying some business rules — getting the best of all worlds!
Pay attention: Reviewing classified records no matter what approach used should be prioritized to where potential value is laying. There are wrong expectations around having 95% or 100% accuracy on the classification — this is a trap! don’t fall into it. Always think about the “WHY” and the aim of these initiatives: capturing value and saving cost for the organization — therefore knowing that all records cannot be reviewed at the same time — it is important to prioritize the review itself and the level of checks aligned with the potential value. A good solution will be facilitating this for the users to deep dive when needed while keeping the overview for the next round — this is again an ever-evolving process. Don’t stick to perfection — good is more than good enough (Pareto holds strongly!)
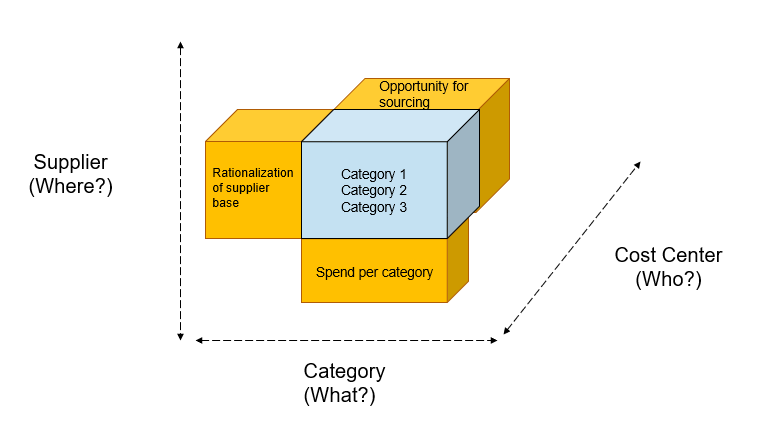
Define your cube
Once you have classified your records — it’s time for effective reporting aligned with your user community identified earlier. Don’t be afraid of creating 100 cubes, testing, and keeping the one that has the most adoption and benefits to the business and business users.
The ultimate goal of spend analysis is to answer WHO is buying WHAT from WHOM, WHEN, in WHAT quantity, WHERE they are being shipped, and HOW MUCH are they paying for it. The only question we don’t answer here is WHY assuming there were needs for business for each transaction. As part of the analysis once the reporting is live: this assumption should be challenged by each of the commodity leaders during the review periods described above.
Who: Cost centers / Business unites / function’s name
What: GL Account, Description, existing spend taxonomy
Where: Ship to location
When: Invoice date
How: PO number (ID) &
Whom: Vendor name / ID
Analyze, assess, decide and execute
As you have your spend cube in place ready for businesses to utilize them there are a couple of best practices not to forget:
- Centralized effort: Make sure there is a centralized team (e.g. COE / Analytics) who owned the tools and processed and maintained/ resolved any obstacles as being identified.
- Getting the business pulse: Constant check-in with business and community users is key to improve the infrastructure as well as increase adoption.
- Reviews: knowing this is an ever-evolving and repetitive process central team should be holding open communication on any changes as well as holding review workshops one or twice a year to assess and understand if any major changes are needed on any of the components (does taxonomy needs to go through modification, shall refresh period be modified, etc.)
Refresh and Repeat
Last but not least is the ability to stabilize and automate these operations for the next rounds. For a bigger scale organization, this usually requires proper data infrastructure to capture, assess, cleans the data and to provide consistent output. consistency (whether right or wrong! ) is key here versus for smaller organizations this might need some basic data flows and ownerships by FTE’s. The refresh cadence should be aligned to companies’ needs and capabilities in terms of producing these transactions in the first place (e.g. AP data usually have lead times of 90 days before they are fully available). In recent research, over 70% of the companies refresh their data quarterly or monthly but again this needs to satisfy business needs as well as be achievable with the current resource allocated to this activity. The key is not to compromise accuracy and trust in the data to timing and speed.

Turbocharge Category Strategy Execution
Turbocharge your category strategy execution & drive continuous business value Category owners invest significant time in stakeholder engagement, in data...
Rewiring Spend Analytics
Rewiring Spend Analytics - the New Era Procurement has more than ever to gain from advances in technology—and more to...